今天统计价格变化规律的时候找到的一个很好的文档,很详细
一、简介
Ø FusionCharts 是InfoSoft Global 公司的一个产品,InfoSoft Global 公司是专业的Flash 图形方案提供商,他们还有几款其他的,基于Flash 技术的产品,都非常的漂亮。
Ø FusionCharts Free 则是FusionCharts 提供的一个免费版本,虽然免费,功能依然强大,图形类型依然丰富。
Ø FusionCharts free 是一个跨平台,跨浏览器的flash 图表组件解决方案,能够被ASP.NET, ASP, PHP, JSP, ColdFusion, Ruby on Rails, 简单HTML 页面甚至PPT 调用。
Ø FusionCharts free新版本中所做的改动:
• 增加了使用jsp 和Ruby on Rails 来集成FusionCharts 的代码和文档。
• FusionCharts DOM 更加容易地把图表加载到页面上。
• 修改了.Net 的使用代码和文档。
• 增加了新的PHP API ,并修复了一些BUG。
• 修改了FusionCharts.js ,以便可以支持双引号。
• 增加了在FusionCharts 使用UTF-8 编码的示例。
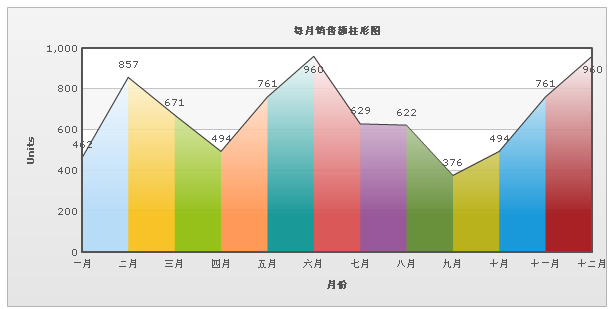
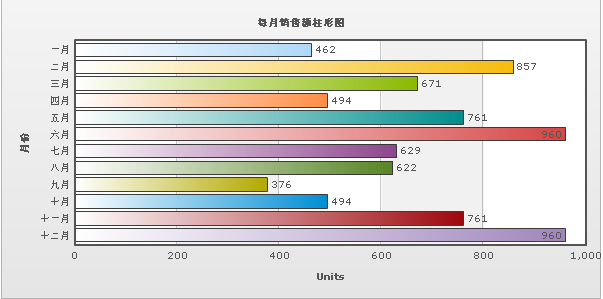
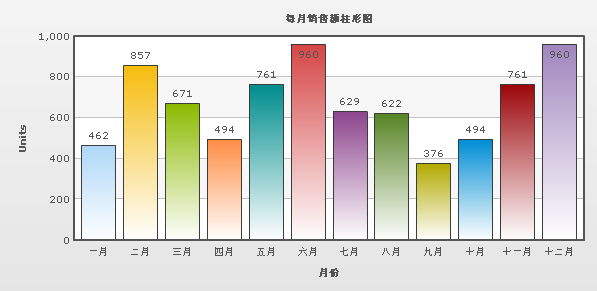
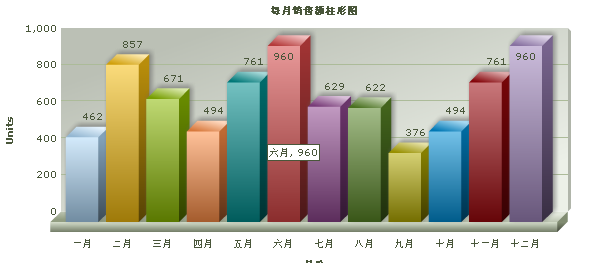
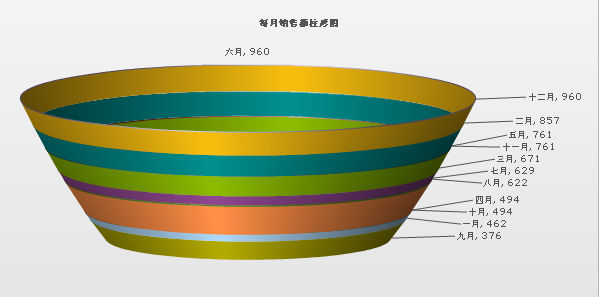
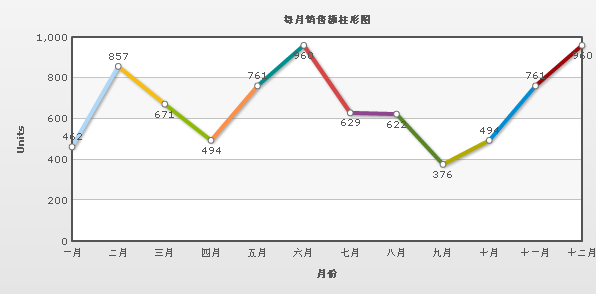
二、部分效果展示
三、报表图形对应的swf文件分类
| 图形类型 | 文件名 |
| Single Series Charts(单系列图形) | |
| Column 3D | FCF_Column3D.swf |
| Column 2D | FCF_Column2D.swf |
| Line 2D | FCF_Line.swf |
| Area 2D | FCF_Area2D.swf |
| Bar 2D | FCF_Bar2D.swf |
| Pie 2D | FCF_Pie2D.swf |
| Pie 3D | FCF_Pie3D.swf |
| Doughnut 2D | FCF_Doughnut2D.swf |
| Multi-series Charts(多系列图形) | |
| Multi-series Column 2D | FCF_MSColumn2D.swf |
| Multi-series Column 3D | FCF_MSColumn3D.swf |
| Multi-series Line 2D | FCF_MSLine.swf |
| Multi-series Bar 2D | FCF_MSBar2D.swf |
| Multi-series Area 2D | FCF_MSArea2D.swf |
| Stacked Charts(堆栈图) | |
| Stacked Column 3D | FCF_StackedColumn3D.swf |
| Stacked Column 2D | FCF_StackedColumn2D.swf |
| Stacked Bar 2D | FCF_StackedBar2D.swf |
| Stacked Area 2D | FCF_StackedArea2D.swf |
| Combination Charts(组合图) | |
| Multi-series Column 3D + Line - Dual Y Axis | FCF_MSColumn2DLineDY.swf |
| Multi-series Column 3D + Line - Dual Y Axis | FCF_MSColumn3DLineDY.swf |
| Financial Charts(财经图,即蜡烛图) | |
| Candlestick Chart | FCF_Candlestick.swf |
| Funnel Chart(漏斗图) | |
| Funnel Chart | FCF_Funnel.swf |
| Gantt Chart(甘特图) | |
| Gantt Chart | FCF_Gantt.swf |
四、安装使用
1. 在web项目目录下新建一个文件夹( 如FusionCharts),并把所有的SWF 文件都拷贝到这个文件夹里。
2. 在页面导入FusionCharts.js 文件,如:
<script type="text/javascript" src="FusionCharts.js"></script>
3. js加载数据生成报表(有两种方法)
方法一:xml文件引用法
(1)定义一个固定格式的xml文件(以Data.xml为例)
Date.xml的内容如下:
| <graph caption='每月销售额柱形图' xAxisName='月份' yAxisName='Units' showNames='1' decimalPrecision='0' formatNumberScale='0'> <set name='一月' value='462' color='AFD8F8' /> <set name='二月' value='857' color='F6BD0F' /> <set name='三月' value='671' color='8BBA00' /> <set name='四月' value='494' color='FF8E46' /> <set name='五月' value='761' color='008E8E' /> <set name='六月' value='960' color='D64646' /> <set name='七月' value='629' color='8E468E' /> <set name='八月' value='622' color='588526' /> <set name='九月' value='376' color='B3AA00' /> <set name='十月' value='494' color='008ED6' /> <set name='十一月' value='761' color='9D080D' /> <set name='十二月' value='960' color='A186BE' /> </graph> |
(2) js加载方法,代码如下:
| <div id=”chartdiv1”></div> <script type="text/javascript"> var myChart2 = new FusionCharts("../FusionCharts/FCF_Column3D.swf","myChartId2", "600","300"); myChart2.setDataURL("Data.xml"); myChart2.render("chartdiv1"); </script> |
方法二:字符串加载法
(1) 定义一个有固定格式的字符串,即可以将上述xml文件组合成字符串
| var dataXml = “<graph caption='每月销售额柱形图' xAxisName='月份' yAxisName='Units' showNames='1' decimalPrecision='0' formatNumberScale='0'><set name='一月' value='462' color='AFD8F8' /><set name='二月' value='857' color='F6BD0F' /><set name='三月' value='671' color='8BBA00' /><set name='四月' value='494' color='FF8E46' /><set name='五月' value='761' color='008E8E' /><set name='六月' value='960' color='D64646' /><set name='七月' value='629' color='8E468E' /><set name='八月' value='622' color='588526' /><set name='九月' value='376' color='B3AA00' /><set name='十月' value='494' color='008ED6' /><set name='十一月' value='761' color='9D080D' /><set name='十二月' value='960' color='A186BE' /></graph>”; |
(2)js加载方法,代码如下:
| <div id=”chartdiv1”></div> <script type="text/javascript"> var myChart2 = new FusionCharts("../FusionCharts/FCF_Column3D.swf","myChartId2", "600","300"); myChart2.setDataURL(dataXml); myChart2.render("chartdiv1"); </script> |
解析:操作步骤:
<1>建立对象:
用四个参数建立了一个FusionCharts对象,
var myChart = new FusionCharts("../FusionCharts/FCF_Column3D.swf", "myChartId", "600", "500");
第一个参数是SWF文件的地址。
第二个是图形的id。这个id可以随便叫什么,但是要注意,当一个页面里有多个图形的时候,这个id一定要是唯一的。
第三个参数是图形的宽。
第四个参数是图形的高。
<2> 加载数据:
第一种加载方法需要设置数据文件的地址。如:
myChart.setDataURL("Data.xml");
第二种加载方法需要设置对应的字符串。如:
myChart2.setDataURL(dataXml); //dataXml为字符串
<3> 把图形渲染在指定的地方。
myChart.render("chartdiv");
"chartdiv"就是前面的DIV的id,这就表示把图形render到"chartdiv",即Flash图形就出现在这个id为"chartdiv1"的DIV里。
四、引起flash图像不能显示的可能原因
(一)如果没有在页面上看到图形,可能是下面的原因之一:
1. SWF没有放到正确的文件夹。
2. 在html文件里,SWF的路径设置不正确。
3. 没有安装Flash Player。
4. 没有启用浏览器Flash播放选项。
(二)如果你得到了一个“Error in Loading Data”的消息,可能是:
1. xml文件没放到正确的文件夹。
2. xml的文件名不正确。比如,你可能不小心把它命名Data.xml.txt。
(三)如果你得到了一个“Invalid XML Data”的消息,可能是:
1. xml文件里的内容有错误。
五、特殊字符
在FCF里,一些特殊的编码都需要经过编码。如:
“€”欧元符号 ——— 需要用“%80”替换
“£”英镑符号 ——— 需要用“%A3”替换
“¥”人名币符号—— 需要用“%A5”替换
“¢”分符号 ————需要用“%A2”替换
“%”百分号 ———— 需要用“%25”替换
“&”连字符 ———— 需要用“&”替换
“>”大于号 ———— 需要用“>”替换
“'”单引号 ———— 需要用“'”替换
如果要显示双引号,直接使用就可以了,前提是属性值是用单引号括起来的。如果属性值是用双引号括起来的,要显示单引号,也可以直接使用,而不必用“'”来替换它。
五、属性参数大全
FusionCharts的XML标签属性有以下四种数据类型:
* Boolean - 布尔类型,只能为1或者0。例如:<graph showNames=’1’>
* Number - 数字类型,只能为数字。例如:<graph yAxisMaxValue=’200’>
* String - 字符串类型,只能为字符串。例如:<graph caption=’My Chart’ >
* HexColorCode - 六进制颜色代码,前边没有‘#’。例如:<graph bgColor=’FFFFDD’>
<><><><><><><><><><><><><><><><><><><><><><><><><><><><><><><><><><><>
1. 功能特性
animation …………………………[bool]是否动画显示数据,默认为1(True)
palette …………………………… [number]使用默认的调色板(1-5)
showNames ………………………[bool]是否显示横向坐标轴(x轴)标签名称
showLables ………………………[bool]是否显示标签,默认为1(True)显示(set中有lable属性时)
rotateNames ………………………[bool]是否旋转显示标签(name),默认为0(False):横向显示
rotateLabels ………………………[bool]设置x轴上的lable显示方式,默认为0横向显示
showValues ………………………[bool]是否在图表显示对应的数据值,默认为1(True)
yAxisMinValue ………………… [number]指定纵轴(y轴)最小值,数字
yAxisMaxValue ………………… [number] 指定纵轴(y轴)最小值,数字
showLimits ………………………[bool]是否显示图表限值(y轴最大、最小值),默认为1(True)
labelDisplay ………………………[string ]标签的呈现方式[“WRAP”,”STAGGER”,”ROTATE”,
“NONE”](超长屏蔽、折行、倾斜、不显示)
staggerLines …………………… [number]多少个字符后折行(labelDisplay=’stagger’)
rotateValues ………………………[bool]是否滚动显示值 (showValues=’1’)
showYAxisValues …………………[bool]是否显示y轴数据
yAxisValuesStep ………………… [number]y轴标记的显示间隔
adjustDiv …………………………[bool]自动调整divlines
clickURL …………………………[string]图表的焦点链接地址
defaultAnimation …………………[bool]是否开启默认动画
connectNullData …………………[bool]是否呈现空值(?)
slantLabels ……………………… [bool]
showDivLineValues ………………[bool]
rotateYAxisName …………………[bool]
yAxisNameWidth ……………… [number] (In Pixels)
labelStep ……………………… [number] (1 or above)
setAdaptiveYMin
<><><><><><><><><><><><><><><><><><><><><><><><><><><><><><><><><><><>
2. 图表标题和轴名称
caption ………………………… [string]图表主标题
subCaption ………………………[string] 图表副标题
xAxisName …………………… [string]横向坐标轴(x轴)名称
yAxisName ……………………[string] 纵向坐标轴(y轴)名称
<><><><><><><><><><><><><><><><><><><><><><><><><><><><><><><><><><><>
3. 图表和画布的样式
bgColor ……………………[color]图表背景色,可以使用逗号分割多个颜色值 6位16进制颜色值
bgRatio ………………………[number]多个颜色值所占的比率,[0-100]
bgAngle ………………………[number]角度,[0-360]
bgSWF ……………………… [string] 设置一个外部的Flash 为flash的背景(须在同一个域下)
bgSWFAlpha …………………[number] 背景flash透明度,[0-100]
bgAlpha……………………… [number]设置图表背景透明度,[0-100]
shadowAlpha …………………[number]投影透明度,[0-100]
showLegend ………………… [bool]是否显示系列名,默认为1(True)
canvasBgColor …………………[color]画布背景色,6位16进制颜色值
canvasBgAlpha …………………[number]画布透明度,[0-100] 0为不透明
canvasBorderColor …………… [color]画布边框颜色,6位16进制颜色值
canvasBorderThickness …………[number]画布边框厚度,[0-100]
canvasBaseColor ……………… [color]设置图表基部的颜色,6位16进制颜色值
canvasBaseDepth ……………… [number]设置图表基部的高度
canvasBgDepth …………………[number]设置图表背景的深度
showCanvasBg …………………[bool]设置是否显示图表背景
showBorder …………………… [bool]画布透明度,默认为1显示
showCanvasBase ………………[bool]设置是否显示图表基部
pieFillAlpha ……………………[number]各色块填充颜色的深度
pieSliceDepth …………………[bool]设置各个色块间隔线的宽度(不能与pieBorderAlpha同用)
useRoundEdges ……………… [bool]设置图表图形边角是否是为圆角,默认为0不是
chartLeftMargin ……………… [number]设置图表左边距,像素
chartRightMargin ………………[number]设置图表右边距,像素
chartTopMargin ……………… [number]设置图表上边距,像素
chartBottomMargin ……………[number]设置图表下边距,像素
canvasBgRatio …………………[ ?]
canvasBgAngle …………………[number]
borderColor ……………………[color]
borderThickness ……………… [number]
borderAlpha ……………………[number]
canvasBorderAlpha ……………[number]
captionPadding …………………[?]
xAxisNamePadding ……………[?]
yAxisNamePadding ……………[?]
yAxisValuesPadding ……………[?]
labelPadding ……………………[?]
valuePadding ……………………[?]
canvasPadding
<><><><><><><><><><><><><><><><><><><><><><><><><><><><><><><><><><><>
4. 字体属性
baseFont ………………………[string]图表字体样式,如“宋体”、“黑体”
baseFontSize ………………… [number]图表字体大小
baseFontColor …………………[color]图表字体颜色,6位16进制颜色值
outCnvBaseFont ………………[string]图表画布以外的字体样式
outCnvBaseFontSize ………… [number]图表画布以外的字体大小
outCnvBaseFontColor ……… [color]图表画布以外的字体颜色,6位16进制颜色值
<><><><><><><><><><><><><><><><><><><><><><><><><><><><><><><><><><><>
5. 分区线和网格
numDivLines ……………………[string]画布内部水平分区线条数,数字
divLineColor ……………………[string]水平分区线颜色,6位16进制颜色值
divLineThickness ……………… [string]水平分区线厚度,[1-5]
divLineAlpha ……………………[string]水平分区线透明度,[0-100]
showAlternateHGridColor ………[string]是否在横向网格带交替的颜色,默认为0(False)
alternateHGridColor ……………[string]横向网格带交替的颜色,6位16进制颜色值
alternateHGridAlpha ……………[string]横向网格带的透明度,[0-100]
showDivLineValues …………… [string]是否显示Div行的值,默认??
numVDivLines ………………… [string]画布内部垂直分区线条数,数字
vDivLineColor ………………… [string]垂直分区线颜色,6位16进制颜色值
vDivLineThickness ………………[string]垂直分区线厚度,[1-5]
vDivLineAlpha ……………………[string]垂直分区线透明度,[0-100]
showAlternateVGridColor ………[string]是否在纵向网格带交替的颜色,默认为0(False)
alternateVGridColor …………… [string]纵向网格带交替的颜色,6位16进制颜色值
alternateVGridAlpha …………… [string]纵向网格带的透明度,[0-100]
plotGradientColor ………………[color]渐变颜色,6位16进制颜色值
plotBorderDashed ………………[string]bool 是否使用虚线(柱形图边界线)
divLineIsDashed ……………… [bool]画布背景线条是否为虚线
alternateHGridColor ……………[color] 画布背景横向线条之间交替出现的颜色
showPlotBorder …………………[bool]
plotBorderColor …………………[color]
plotBorderThickness ……………[number][0-5]
plotBorderAlpha …………………[number]
plotBorderDashLen ……………[number] pixels
plotBorderDashGap ……………[number] pixels
plotFillAngle ………………… [number] [0-360]
plotFillRatio ……………………[number] [0-100]
plotFillAlpha ……………………[number]
showShadow ……………………[bool]是否显示阴影
plotFillColor ……………………[color]
Anchors …………………………[?]
drawAnchors ……………………[bool]
anchorSides ……………………[number]边数[3-20]
anchorRadius ………………… [number] pixels 半径
anchorBorderColor …………… [color]
anchorBorderThickness …………[number]
anchorBgColor ……………… [string]
anchorAlpha ……………………[number]
anchorBgAlpha …………………[number]
divLineDashLen ……………… [?]
divLineDashGap ……………… [?]
zeroPlaneColor …………………[color]
zeroPlaneThickness ……………[number]
zeroPlaneAlpha …………………[number]
showAlternateHGridColor ………[color]
alternateHGridAlpha ……………[number]
vDivLineIsDashed ………………[?]
vDivLineDashLen ………………[?]
vDivLineDashGap ………………[?]
showAlternateVGridColor ………[color]
alternateVGridColor …………… [color]
alternateVGridAlpha ……………[number]
<><><><><><><><><><><><><><><><><><><><><><><><><><><><><><><><><><><>
6. 数字格式
numberPrefix ……………………[string]增加数字前缀
numberSuffix ……………………[string]增加数字后缀
formatNumberScale …………… [bool]是否格式化数字,默认为1(True),自动的给你的数字加上K(千)或M(百万);若取0,则不加K或M
decimalPrecision …………………[number]指定小数位的位数,[0-10] 例如:='0' 取整
divLineDecimalPrecision …………[number]指定水平分区线的值小数位的位数,[0-10]
limitsDecimalPrecision ………… [number]指定y轴最大、最小值的小数位的位数,[0-10]
formatNumber ……………………[number]逗号来分隔数字(千位,百万位),默认为1(True);若取0,则不加分隔符
decimalSeparator …………………[number]指定小数分隔符,默认为'.'
thousandSeparator ………………[number]指定千分位分隔符,默认为','
decimalSeparator ……………… [number]用指定的字符来代替小数点
thousandSeparato ……………… [number]用指定的字符来代替千位分隔符
decimals …………………………[number]设置鼠标悬停在图表上显示百分比的精确度[0-10]
(不能与formatNumberScale='0' formatNumber='0'同用)
defaultNumberScale …………… [string]
numberScaleUnit ……………… [string]
numberScaleValue ………………[string]
inDecimalSeparator …………… [string]
inThousandSeparator ……………[string]
forceDecimals ……………………[bool]
yAxisValueDecimals ……………[number] [0-10]
<><><><><><><><><><><><><><><><><><><><><><><><><><><><><><><><><><><>
7. Tool-tip/Hover标题
Showhovercap ………………… [bool]是否显示悬停说明框,默认为1(True)
hoverCapBgColor ………………[color]悬停说明框背景色,6位16进制颜色值
hoverCapBorderColor ………… [color]悬停说明框边框颜色,6位16进制颜色值
hoverCapSepChar ………………[string]指定悬停说明框内值与值之间分隔符,默认为','
showToolTip ……………………[bool]
toolTipBgColor …………………[color] 6位16进制颜色值
toolTipBorderColor …………… [color] 6位16进制颜色值
toolTipSepChar …………………[string]
<><><><><><><><><><><><><><><><><><><><><><><><><><><><><><><><><><><>
8. 折线图的参数
lineThickness ……………………[number]折线的厚度
anchorRadius ……………………[number]折线节点半径,数字
anchorBgAlpha …………………[number]折线节点透明度,[0-100]
anchorBgColor …………………[color]折线节点填充颜色,6位16进制颜色值
anchorBorderColor …………… [color]折线节点边框颜色,6位16进制颜色值
多条折线中<dateset>的参数:
Seriesname ……………………[string]折线的名称
color ………………………… [color]折线的颜色
showValue …………………… [bool]是否显示折线的节点值
showName ………………………[bool]是否显示折线的名称
alpha ………………………… [number]折线的透明度
anchorAlpha ……………………[bool]是否显示折线的节点,默认为0不显示
lineThickness …………………[number]折线的厚度
<><><><><><><><><><><><><><><><><><><><><><><><><><><><><><><><><><><>
9. Set标签使用的参数
value ……………………………[number/string]设置在图表中各个名字想对应的值
color ……………………………[color]置在图表中相对应的柱行图的颜色
name ……………………………[number/string]横向坐标轴标签名称
showName …………………… [bool]设置在是否显示图表中相对应X轴的name,默认为1显示
hoverText …………………… [string]设置鼠标旋停在相对应图表上出现的文本内容
alpha ………………………… [number]设置在图表中相对应的柱行图的透明度
link ……………………………[string]设置该柱行图的链接地址(需要URL Encode重编码)(本窗口打开[Url],新窗口打开[n-Url],调用JS函数[JavaScript:函数])
thickness ………………………[number]
toolText ……………………… [string]
showLavel ……………………[?]
showValue ……………………[bool]
dashed ……………………… [?]
alpha …………………………[?]
anchorSides …………………[?]
anchorRadius …………………[?]
anchorBorderColor ……………[color]
anchorBorderThickness ………[number]
anchorBgColor ………………[color]
anchorAlpha …………………[number]
anchorBgAlpha ………………[number]
dashLen ………………………[?]
dashGap ………………………[?]
startValue ……………………[?]
endValue ……………………[?]
displayValue ……………… [?]
isTrendZone ……………… [?]
showOnTop ……………… [?]
valueOnRight ………………[?]
例1:
<set label=’Dec 2005′ value=’36556′ />
<vLine color=’FF5904′ />
<set label=’Jan 2006′ value=’45456′ />
例2:
<trendLines>
<line startValue=’895′ color=’FF0000′ displayvalue=’Average’ />
</trendLines>
<><><><><><><><><><><><><><><><><><><><><><><><><><><><><><><><><><><>
六、Object
ANCHORS 锚点 用于标识line或area的数值点
支持效果 Animation 动画、Shadow 阴影、Glow 发光、Bevel 倾斜、Blur 模糊
动画属性 _alpha、_x、_y、_xScale、_yScale
BACKGROUND 整个图表的背景
支持属性 Animation、Shadow、Glow、Bevel、Blur
动画属性 _alpha、_x、_y、_xScale、_yScale
CANVAS 区域图中的区域
支持属性 Animation、Shadow、Glow、Bevel、Blur
动画属性 _alpha、_x、_y、_xScale、_yScale
CAPTION 图表标题
SUBCAPTION 图表子标题
支持属性 Animation、Shadow、Glow、Bevel、Blur、Font 字体
动画属性 _alpha、_x、_y
DATALABELS 数据的x轴标签列表
支持属性 Animation、Shadow、Glow、Bevel、Blur、Font 字体
动画属性 _alpha、_x、_y
DATAPLOT 数据细节(如:2D图表中的列)
支持属性 Animation、Shadow、Glow、Bevel、Blur
动画属性 _alpha、_x、_y、_xScale、_yScale
DATAVALUES 图表数据
支持属性 Animation、Shadow、Glow、Bevel、Blur、Font 字体
动画属性 _alpha、_x、_y
DIVLINES 水平的列表区域(由div组成的线)
支持属性 Animation、Shadow、Glow、Bevel、Blur
动画属性 _alpha、_x、_y、_xScale
HGRID 水平的两个列表区域中交替的颜色
支持属性 Animation、Shadow、Glow、Bevel、Blur
动画属性 _alpha、_x、_y、_xScale、_yScale
VDIVLINES 垂直的列表区域
VGRID 垂直的两个列表区域中交替的颜色
VLINES 垂直分割线
XAXISNAME x轴名称
YAXISNAME y轴名称
YAXISVALUES y轴的值列表
TOOLTIP 在鼠标移动到数据点上的时候的提示
支持属性 Font
TRENDLINES 趋势线
